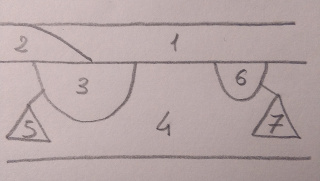
Fig. 1 - An idealized stratigraphy.
Stratigraphic units can be exported in two formats:
- HTML: it's a formatted sheet, suitable for inclusion "as is" in reports and scientific
documents.
- txt: unformatted text file where data of each S.U. are listed in two column (attribute-value).
Ideally, this is a format more suitable for further computer analysis, although I.L.I.U.M. does
not offer any facility
in this sense.
Once created, the files are stored in the same folder of the intervention, and named by the
intervention name followed
by the extension ".HTML" or ".txt".
Excavation journal can be exported in HTML.
Only journal entries classified as "public" will be exported.
Once created, the files are stored in the same folder of the intervention, and named by the
intervention name plus the postfix "_journal" followed
by the extension ".HTML" or ".txt".
Please do not confuse the file [excavation name]_journal.html with the file [excavation
name].ilium-journal
The latter is a file created automatically by Android at the time of creating the excavation.
It represents temporary data used by the excavation database file and and it does not concern
the user.
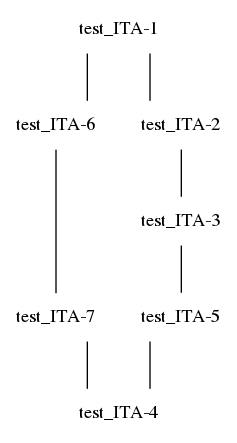
The Harris' matrix1 of the stratigraphic units
can be stored in a ".dot" file.
The latter is a plain text file that is a standard for rendering "flow" or "network" graphs,
hence it's suitable
for the stratigraphic matrix.
The file is saved in the same folder of the intervention, and named by the intervention name
followed
by the extension ".dot".
It can be opened and rendered to a graphic format (.svg, .png, .pdf ...) by Graphviz,
an open source graph visualization software.2